Deal Flow Statistics
The Tamiami Angel Funds have been actively soliciting deal flow since our first Fund's inception in 2010. Since then the Funds have reviewed 841+ applications from all industries throughout the United States. To help entrepreneurs ascertain the expectations of the Angel Investor marketplace, we have provided tabulated quarterly analytics. For quarters where the number of applicants is > 30, then assume that the number of applicants is sufficiently large, so that the sampling distribution is approximately normal. Mean values are calculated utilizing data analyzed from the most recent quarter detailed below.
|
|
Mean: $919,461
|
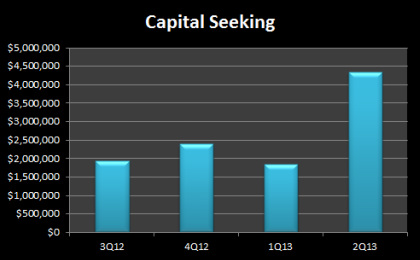
Mean: $4,338,183
|
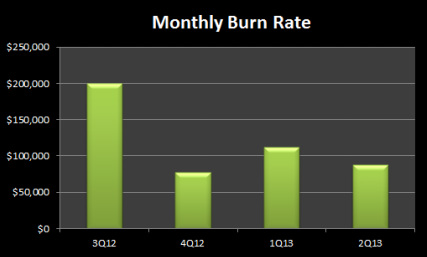
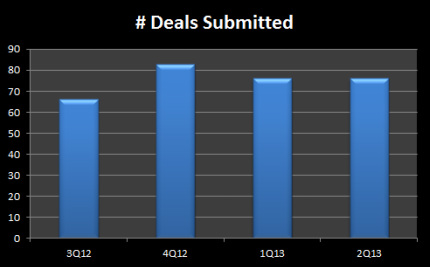
Mean: $87,487
|
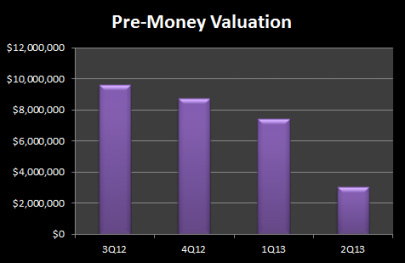
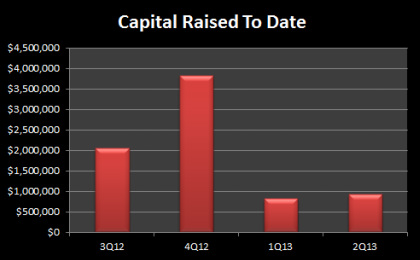
Mean: $3,073,903
|
